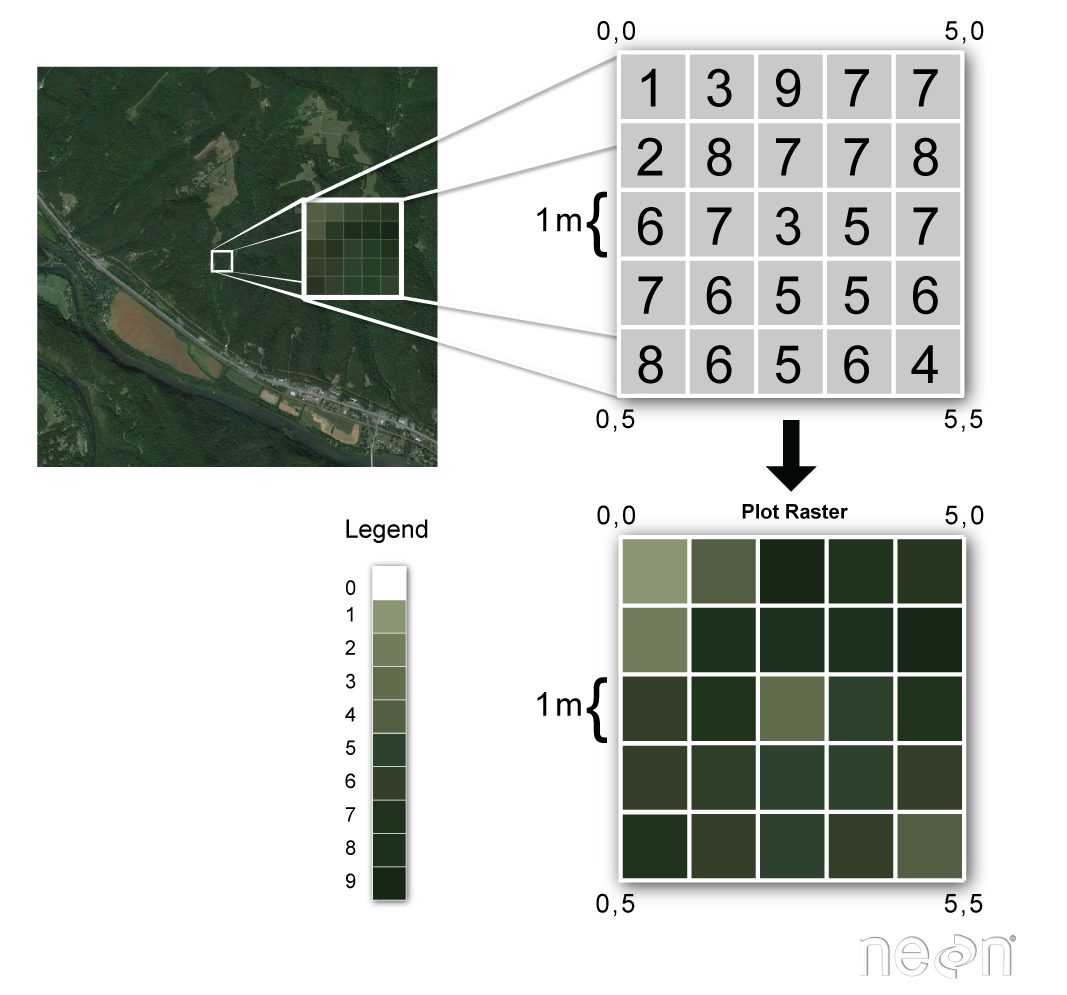
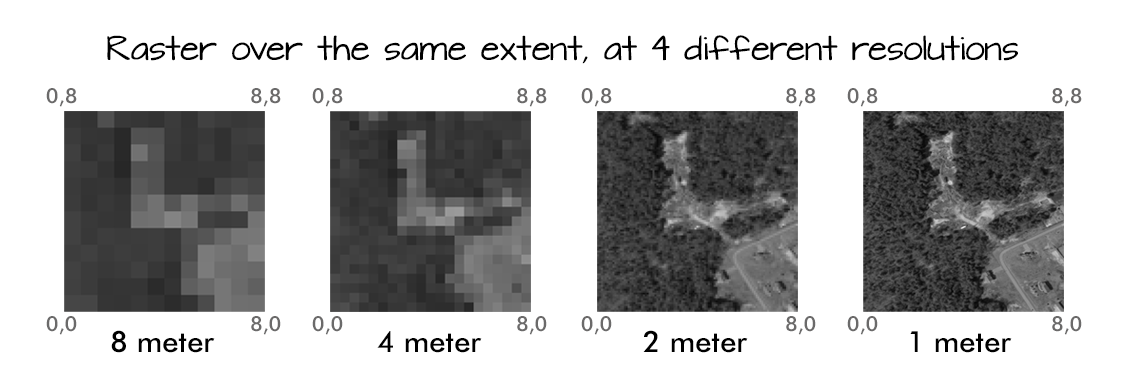
class: center, middle, inverse, title-slide # R for geographic map: Session 2 ## Manipulate a raster data in R --- ## DAAD climapAfrica - Climate change research in Africa <center><img src="https://api.daad.de/api/image/xl1st/media/daad_de/der-daad/was-wir-tun/bnp_ground_hornbill__1_.jpg.webp" height="300px" /></center> .footnote[©Francisco Maiato Gonçalves] --- ## Keep in touch <center><img src="https://pbs.twimg.com/profile_images/1230804251950977024/Ymb__9tM_400x400.jpg" height="200x" /></center> <a href="mailto:yedomon@jbnu.ac.kr"><i class="fa fa-paper-plane fa-fw"></i> <center>Mail: yedomon@jbnu.ac.kr<center></a><br> <a href="https://https://yedomon-site.netlify.app/"><i class="fa fa-link fa-fw"></i> <center>Website: yedomon-site.netlify.app<center></a><br> <a href="http://twitter.com/AngeBovys27"><i class="fa fa-twitter fa-fw"></i> <center>Twitter: @AngeBovys27<center></a><br> <a href="http://github.com/Yedomon"><i class="fa fa-github fa-fw"></i> <center>github: @Yedomon<center></a><br> --- ## Contents - **Definition of a raster data** - **Utility of a raster data** - **Hands on session** --- class: inverse center middle # What is a raster data? --- ## What is a raster data? <center><img src="https://datacarpentry.org/organization-geospatial/fig/dc-spatial-raster/raster_concept.png" height="400px" /></center> .footnote[©National Ecological Observatory Network (NEON)] --- ## Resolution matters ![](https://datacarpentry.org/organization-geospatial/fig/dc-spatial-raster/raster_resolution.png) .footnote[©National Ecological Observatory Network (NEON)] --- ## You say multi-band raster data? <center><img src="https://datacarpentry.org/organization-geospatial/fig/dc-spatial-raster/RGBSTack_1.jpg" height="400px" /></center> .footnote[©National Ecological Observatory Network (NEON)] --- class: inverse center middle # Why store data as a raster? --- ## Why store data as a raster? **The advantages of storing your data as a raster are as follows:** - <p style='text-align: justify;'> A simple data structure—A matrix of cells with values representing a coordinate and sometimes linked to an attribute table - <p style='text-align: justify;'> A powerful format for advanced spatial and statistical analysis </p> - <p style='text-align: justify;'> The ability to represent continuous surfaces and perform surface analysis </p> - <p style='text-align: justify;'> The ability to uniformly store points, lines, polygons, and surfaces </p> - <p style='text-align: justify;'> The ability to perform fast overlays with complex datasets </p> .footnote[©ArcGIS] --- ## Why store data as a raster? - <p style='text-align: justify;'> There can be spatial inaccuracies due to the limits imposed by the raster dataset cell dimensions </p> - <p style='text-align: justify;'> Raster datasets are potentially very large. Resolution increases as the size of the cell decreases </p> - <p style='text-align: justify;'> However, normally cost also increases in both disk space and processing speeds. For a given area, changing cells to one-half the current size requires as much as four times the storage space, depending on the type of data and storage techniques used. </p> .footnote[©ArcGIS] --- class: inverse center middle #Applications of raster data --- ## Applications of raster data .pull-left[ Raster data are frequently used in diverse domains including: - <p style='text-align: justify;'> species distribution modeling; </p> - <p style='text-align: justify;'> rainfall variability over time; </p> - <p style='text-align: justify;'> forest distribution and/or coverage; </p> - <p style='text-align: justify;'> water supply availability; </p> - <p style='text-align: justify;'> agricultural landscape; </p> - <p style='text-align: justify;'> land distribution; </p> - <p style='text-align: justify;'> vegetation studies; </p> - <p style='text-align: justify;'> wild animal tracking and management. </p> ] .pull-right[ <img src="https://www.researchgate.net/profile/Jesus-Aguirre-Gutierrez/publication/323801521/figure/fig1/AS:641421019197443@1529938096440/Species-distribution-model-SDM-workflow-for-Vaccinium-phillyreoides-occurring-on_W640.jpg" height="400px" > ![]() .center[**©Raes & Aguirre‐Gutiérrez 2018 | John Wiley & Sons Ldt**] ] --- ## Hands on session ### Packages loading ```r library(ggplot2) library(raster) library(tidyr) library(rnaturalearth) library(rgeos) library(cowplot) ``` --- ### Data acquisition ```r climate = getData('worldclim', var = 'bio', res = 2.5) ``` --- ### See the data ``` plot(climate) ``` <center><img src="https://i.ibb.co/qMxfqkr/raster-map1.png" alt="raster-map1" border="0" height="400px" /></center> --- ### Crop the data to the African continent ```r climate = crop(climate, extent(-20, 60, -40, 40)) ``` --- ### Check the data ``` plot(climate) ``` <center><img src="https://i.ibb.co/9n4ynTJ/raster-map2.png" alt="raster-map2" border="0" height="400px" /></center> --- ### Get the raster 12 relative to the rainfall ```r raster_rainfall = climate$bio12 ``` ### Get countries borders shapefiles from the package rnaturalearth ```r africa = rnaturalearth::ne_countries(continent = 'africa', returnclass = 'sf') ``` --- ### Plot it ``` plot(africa) ``` <center><img src="https://i.ibb.co/6XQm45t/raster-map3.png" alt="raster-map3" border="0" height="400px" /></center> --- ### Raster data conversion into dataframe ```r rasdf = as.data.frame(raster_rainfall, xy = TRUE)%>%drop_na() ``` ### Check it ```r head(rasdf) ``` ``` ## x y bio12 ## 1 -8.937500 39.97917 838 ## 2 -8.895833 39.97917 856 ## 3 -8.854167 39.97917 863 ## 4 -8.812500 39.97917 882 ## 5 -8.770833 39.97917 888 ## 6 -8.729167 39.97917 872 ``` --- ### Plotting ```r m = ggplot() + geom_tile(aes(x=x, y=y, fill=bio12), data = rasdf) + geom_sf(fill = 'transparent', data = africa) + scale_fill_viridis_c(name= 'mm/yr', direction = -1 ) + labs(x= 'Longitute' , y = 'Latitude', title = "Africa's climate map", subtitle = "Annual precipitation", caption = 'Source: WordClim, 2020') + cowplot::theme_cowplot() + theme(panel.grid.major = element_line(color = "black", linetype = 'dashed', size = .5), panel.grid.minor = element_blank(), panel.ontop = TRUE, panel.background = element_rect(fill = NA, color = 'black')) ``` --- ### Should get this <center><<img src="https://i.ibb.co/84jTXP5/raster-map4.png" alt="raster-map4" border="0" height="500px" /></center> --- class: center, middle # Your turn.....Thanks! --- .pull-left[ # Acknowledgement <img src="https://www.daad.de/logo.svg" height="100px"> <img src="https://data.sasscal.org/metadata/admin/sasscal-logo-130h.png" height="100px"> <img src="https://wascal.org/wp-content/uploads/2018/12/csm_INTRODUCING_THE_NEW_BRAND_OF_WASCAL_b656ad0b1f-1.jpg" height="200px" > ] .pull-right[ # Bonus [**Click here to get free resources for learning R programming for data science**](https://www.javedali.net/post/r-resources/) <img src="https://www.javedali.net/post/r-resources/featured.png" height="200px" width="1000px"> ]